

We are data nerds. We own it. We’re also passionate about stopping the climate crisis. Fortunately, those two are a good combination.
In fact, we’d argue aggressive, impactful climate action hinges entirely on how you – we’re looking at you, local government leaders – harness data. I wrote about our data-driven approach last month, and our Community Dashboard platform is where you can see how we use data for storytelling.
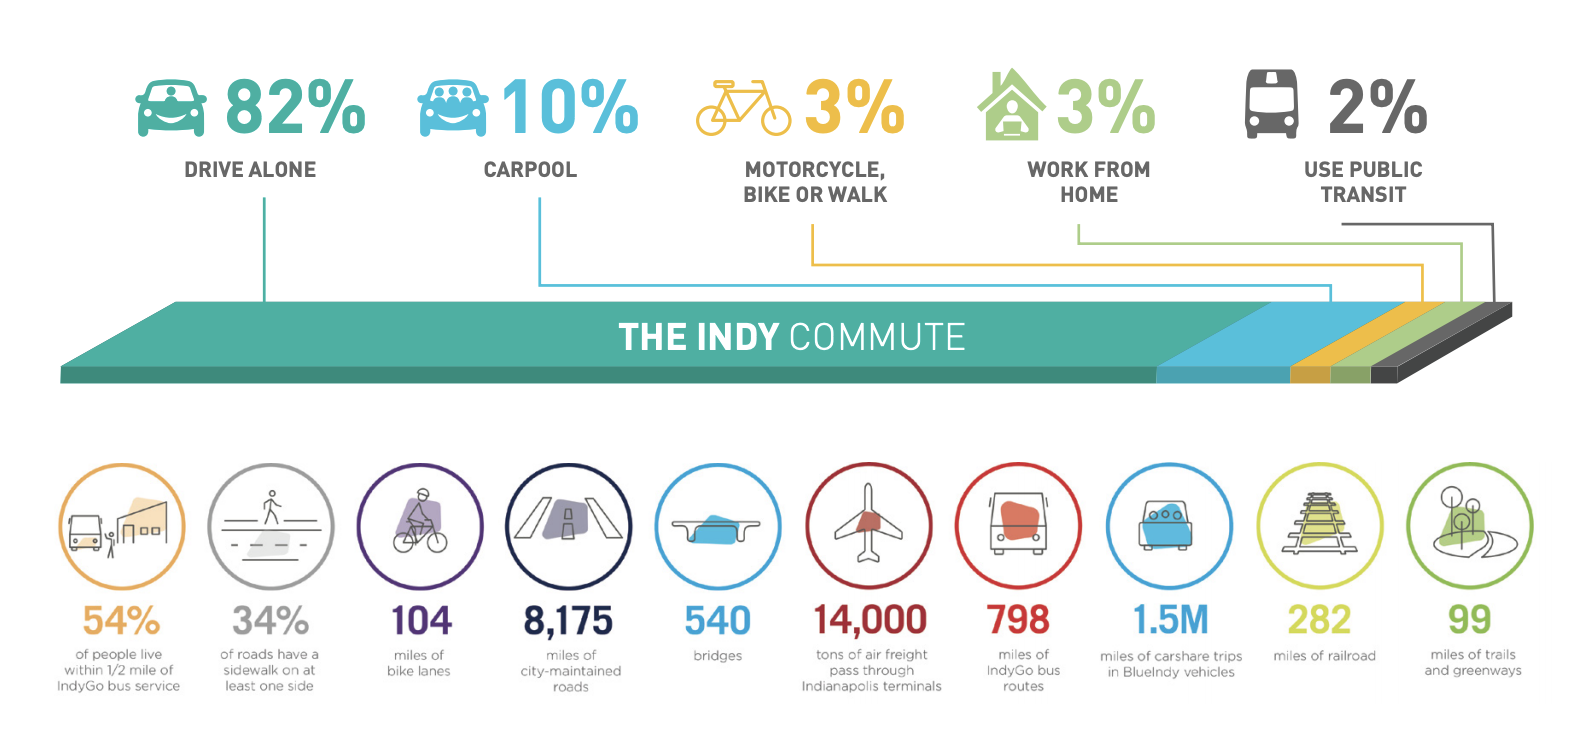
If you don’t get goosebumps thinking about the potential for Vehicle Miles Traveled (VMT), GIS floodplain data, waste tonnage or building square footage, don’t worry we’ve got you covered. This is just some of what the data we had access to (courtesy of the Planning Department) for the Thrive Indianapolis plan's Transportation and Land Use section:
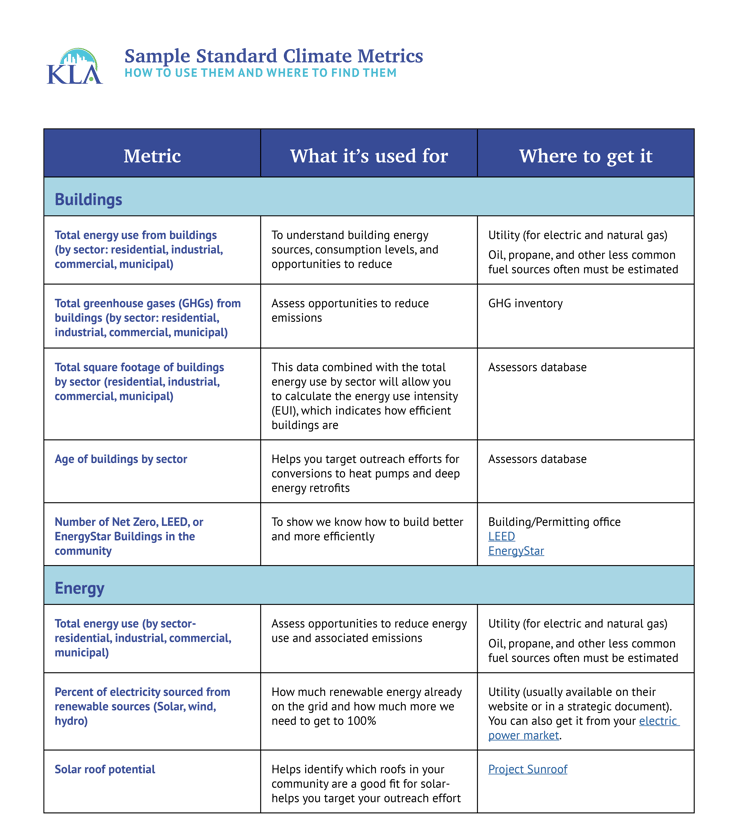
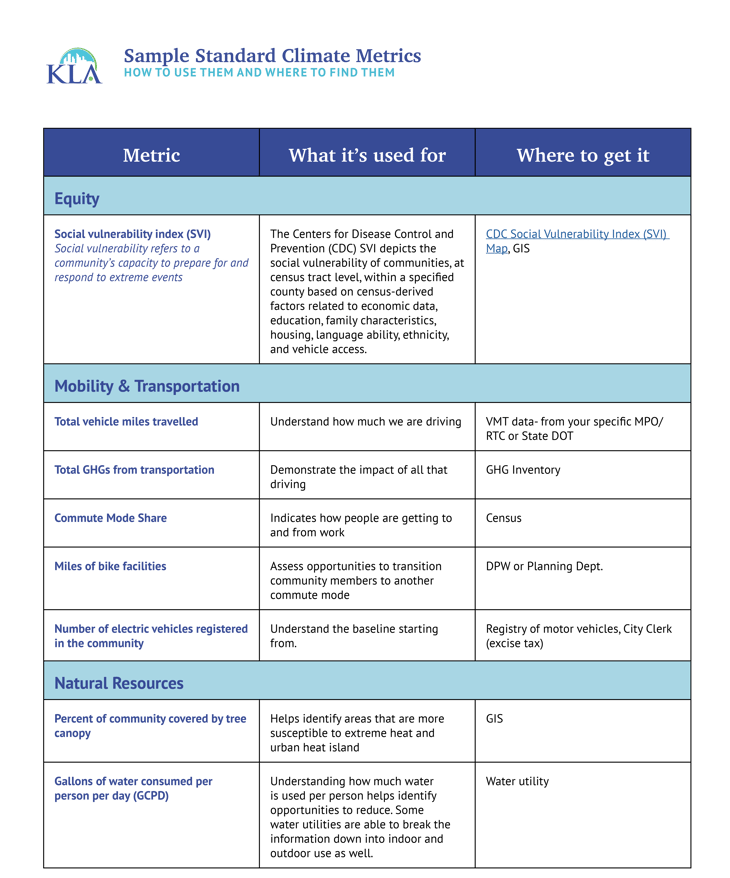
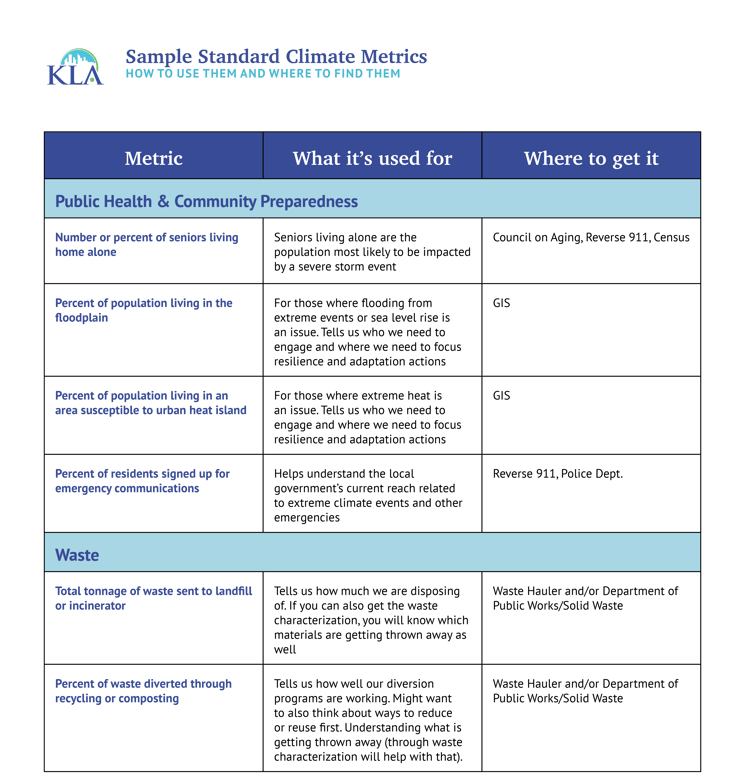
We develop climate action plans for local governments around the clock – for small towns and giant cities and counties – and, through years of experience, we have identified some standard metrics. The table below (or downloadable here) breaks them down by category, why each data point is useful, and where to find it.
Bottom line: do not underestimate the power of a data point to inform your course of action. You don’t just need the data to track progress *after* you set emissions reductions goals; first and foremost, data is the *foundation* of those goals.
The urgency of the climate crisis requires immediate, bold and effective action. Data is how you get there.
So where do you get all that juicy data?
The Biggest Data Sources
The motherlode for climate change data is the recent IPCC Sixth Assessment Report. At 4,000 pages and 14,000 citations, it’s a little intimidating. But we were pleased to see that this time the IPCC included “a more detailed regional assessment of climate change, including a focus on useful information that can inform risk assessment, adaptation, and other decision-making, and a new framework that helps translate physical changes in the climate into what they mean for society and ecosystems.” They also provided a handbook for effective communication that includes helpful tips for IPCC authors...and everyone!
For local governments in the US, one of the best places to get detailed, local, actionable intel about your community is US Census Bureau – especially with fresh data out now from the 2020 census. That can help you understand who is in your community and how to talk to them. As the table below shows, census data, paired with Reverse 911 and Council on Aging data, can tell you how many seniors live alone and would be most vulnerable to a severe storm event or extreme weather.
Grist recently highlighted the potential of census data:
”Analyzing census data can both pinpoint where the issues may be prevalent and highest possible solutions. In Los Angeles county, where on any given night there are an estimated 66,000 people sleeping on the streets, a controversial new rule will soon make it illegal to sleep or lay down in various parks, on sidewalks, and on public benches. The new census data…, however, found that more than 172,000 homes are sitting empty in the county, more than enough to house everyone. The trend is seen virtually everywhere across the country: In total, while there are an estimated 550,000 people experiencing homelessness, there are more than 13.6 million empty homes. This is why Stewart-Martinez says it’s crucial that community members understand just how much power – and how many solutions to our issues – lies in census data.”
Smaller, Local Sources that Pack a Punch
There is power in data from sources far smaller in scope than the US Census.
Still at the national level, NOAA has State of the Climate resources and Regional Climate Assessments.
State-level data is often available. In Massachusetts, home to lots of KLA clients, there's the Massachusetts Decarbonization Roadmap. New York has the Pathways to Deep Carbonization report. And in California you can tap the Roadmap to Decarbonize Buildings and the Achieving Carbon Neutrality in California report.
Ultimately, you’re going to have the best luck crunching numbers at the local level. We’re talking data from the tax assessors office, your utility, planning and public works departments, police and the like.
It might not be the sexiest approach, but it’s the smartest.
The Assessors Database is Where You'll Find the Action
A common and important metric you need to consider for climate action plans is the energy use intensity of different buildings in your community. It's standard to use overall energy use and GHGs for the building sector. But that alone won't help you identify the most effective reduction strategies. A deeper dive will reveal the energy use intensity and GHGs for commercial, industrial, residential and municipal buildings so you identify where the inefficiencies are and where you should focus your efforts.
Do you know the age of the building stock in your community? If you're heavy in new construction, regulation (i.e. building codes) might be the smartest path. More existing buildings could mean you need energy efficiency retrofit education and incentives.
Who owns the bulk of commercial property? We worked with a client recently where we discovered -- through diligent data analysis! -- that 10 people/companies owned 70% of the commercial buildings. In that case, you can start by meeting with those 10 parties as opposed to planning a big public outreach push.
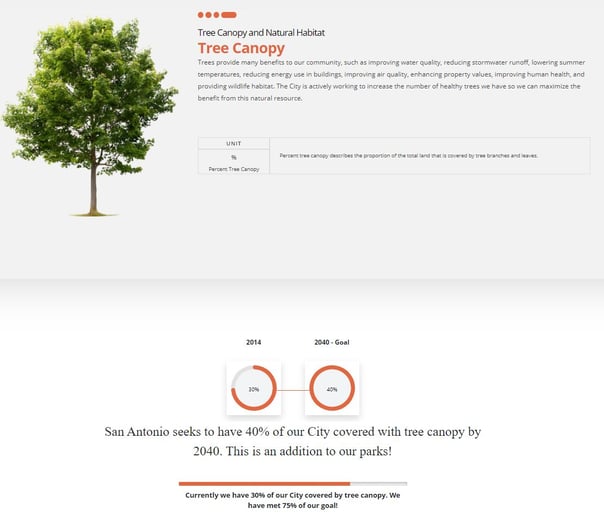
In addition to data seeding climate change mitigation, it’s core to resilience and adaptation efforts as well. Tree canopy coverage data (example shown here from San Antonio's Dashboard) and GIS data on the percent of the population living in an area susceptible to urban heat island can help identify where extreme heat will be a problem and can inform where you might want to consider tree plantings, shade structures, cooling centers and more.
This table breaks down 22 of the standard metrics that we use with clients to inform their climate action plan goals and strategies. It’s important to note that plenty of the metrics that are most useful in that regard aren’t captured in your typical greenhouse gas emissions (GHG) inventory, so don’t stop there.
In our consulting work with clients, we dive deeper into each metric – how relevant is it in this community, how often is the data updated, etc., but this small sampling of metrics highlights the WHY and WHERE for some examples to help you get started now on the best opportunities to drive impactful climate action.
You can download the full table here.
Here’s a sample exercise we’d walk through with our clients:
We know from the GHG inventory that residential buildings are 58% of total community emissions. Even if you do not have a GHG inventory it is safe to say you need to focus on your buildings - all of them.
From the assessor’s database we knew the total residential square footage: 24 million
-
- 2018 average energy use intensity (EUI) = 69 kBTU/sqft
- High performance buildings should be 25 or less
How do we address this? From the assessors information you can also find data that helps develop a targeted campaign to affect real change.
Blanket outreach efforts limit your ability to customize messaging. Based on the information we collected, we can zoom in on the 2,000 single family homes that are running on oil heat or the 4,800 homes that have not been modified since 1980 and are probably due for some upgrades anyway. Those messages and delivery tactics can be very specific and will be far more successful engaging folks to action.
- Target by type:
- single family homes = 7,600
- condominiums = 570
- apartments = 460
- subsidized = 235
- Target by age:
- 6,000 homes built before 1980
- 4,800 not modified since 1980
- Target by fuel:
- Oil heated single-family homes = 2,000
- Electric resistance heated homes = 300
- Other factors for an engagement/outreach campaign:
- What rebates/incentives currently exist in your area to promote a transition to heat pumps and deep energy retrofits?
- What resources exist that you can point people to? Often times these programs are not reaching all community members or they are super complicated to understand how to apply. How can you make it easy for them?
- What opportunities exist to ensure you are supporting an equitable transition to fossil fuel free homes? Can you work with the housing authority to use funds to bring this technology to their properties?
The beauty of these metrics and data analysis process? You do not need a climate action plan or a consultant to to take aggressive action on climate. Use the information you have to get started, and you can weave it into a plan later.
With the right metrics in place, you can dive in and dive deep now to have immediate and lasting impact.
