

5 Common Mistakes and
5 Ways to Get Out of this Rut
We all know the drill. The planning drill. You compile mounds of data, loop in all the right stakeholders, host the community meetings, factor in all the feedback, write the plan, work with a designer to make it look nice, and present it to the powers that be. After that maybe you take a nap, but then it’s off to the implementation races.
But where does that leave your plan and – more importantly – your community?
If the answer is that your plan lives primarily as a PDF document (even a fancy, professionally designed one) on your local government website, that’s a problem….that we can help fix.
In our many years of talking with local government staff about this process, the following scenarios emerge over and over again:
“The File Cabinet Syndrome”

When people go to your local government website to find information about your climate action plan or goals and how to be part of the solutions, do they have to rifle through a boring sea of plain text, hyperlinks and pdf documents?
"The Lost in a Maze Conundrum"

Is this what it feels like for someone to track down your climate action plan or any information on initiatives and progress? Are they navigating a maze of outdated documents, dead links, less-than-useful information, and oh-look-a-chicken distractions?
“The Dusty Bookshelf Syndrome”
.jpeg?width=336&name=View-of-a-german-library-598063032_1258x838%20(1).jpeg)
Did you put all that work into the plan only to watch it – as a pdf on your website – gather dust on the proverbial bookshelf?
“The Sound of Crickets Chirping”
Were you able to jazz people up during the planning stage with tons of opportunities for community engagement and feedback only to hear crickets chirping now?
“The Case of the Glazed Over Eyes”

Do you rely too heavily on the scientific research, technical jargon and confusing charts and graphics that, for most of your community members, is a total turn-off?
You are not alone. We repeat, you are not alone.
This is the reason we developed the KLA Community Dashboard and why you need to think outside the PDF.
5 Ways to Avoid Those Traps
When you use a tool like our Dashboard, you have the power to break up your plan into bite size chunks that are more conducive to engaging people in this fast paced, short attention span world we live in. You can also be transparent and accountable to what you committed through the planning process by tracking and reporting progress in a way that keeps the conversation going with your community as you empower them to act.
Here are some tips to avoid those traps inspired by our Dashboard and with examples:
1.  Pull out the Key Pieces
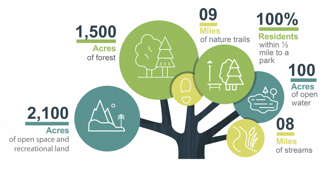
Fine, you need that fancy PDF to print off for stakeholders and decision makers. But recognize that Cindy Citizen isn’t going to download much less read a 60+ page document. Identify the best messaging, statistics, stories and graphics from the plan and give them separate space and prominence on your website. This is an infographic that Devens, MA, uses on its Dashboard pulled from its plan.
2. Keep it Fresh
Just like a new car loses value when you drive it off the lot, a plan packs less punch after it’s finalized. We work with clients to incorporate, attention grabbing headlines, fresh news stories, a blog (like this blog for Concord), event postings, and the ability to move content around so when they come to the site on their mobile device, they will not always see the same content.
3. Add in Eye Candy
We are big on data visualization and infographics at KLA – especially for complicated or nuanced information. Here are some great examples of making data and information user-friendly: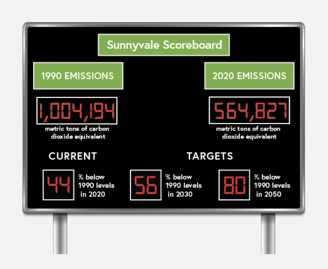
- Pictograph
- Multi-image chart
- Scoreboard (at right)
4. Give People a Way to Engage
In addition to giving people simple, relevant calls to action, two ways to make your climate action goals interactive online are:
• Story maps
• Interactive charts like a GHG Reductions Pathways/Wedge Analysis
5. Use it to be Transparent and Accountable
Your community members and key decision makers will want to know how it’s going, so don't be caught off-guard when someone wants a status-report. The KLA Dashboard has two specific features that address this need:
• 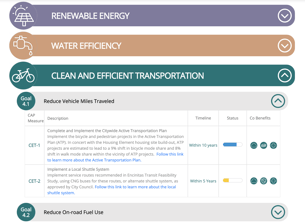 Action Table: Showcase plan elements, goals, actions, and timeline to demonstrate progress. While many performance metrics are only updated once a year, that doesn’t mean nothing is happening. This is a great way to show the actions that are being implemented in pursuit of achieving the goals. Here are examples from the Encinitas Environment Dashboard (also at right), Sunnyvale Climate Action Playbook and the San Antonio Sustainability Dashboard.
•  Annual Report: Like a “print button” to easily produce reports on key content, graphs, images, and data visualizations that are already on your dashboard site. You can update and add content as well if you have a special image or content that does not live on the dashboard or updates related to progress on actions.
However you do it, we strongly encourage you to find a solution where community members and stakeholders can easily access *and engage with* your plan and goals. Don't get stuck in a maze, or filing cabinet, or any of the other traps that come with a PDF-centric climate action plan!
