PlanningMagazine
One day "equity" is a buzzword, the next it's on the chopping block. Working on climate and sustainability, we're no strangers to words and concepts that can be misconstrued and tainted in this politically charged moment. Since you can't as easily erase the climate crisis, take steps now to make sure your work doesn't get canceled.
 
Sharing your initiatives and progress with your community through a KLA Dashboard can help you navigate these times in two key ways: 
  • Buy-In: The platform brings awareness to your residents, businesses and elected officials of the ways your work is benefiting them directly and indirectly. 
    Adaptability: Every community has different ways to talk about climate change, impacts and solutions and different comfort levels with certain language — and all of that is fluid. An online Dashboard allows you to respond to your community, from swapping out words to showcasing the hot topics. 

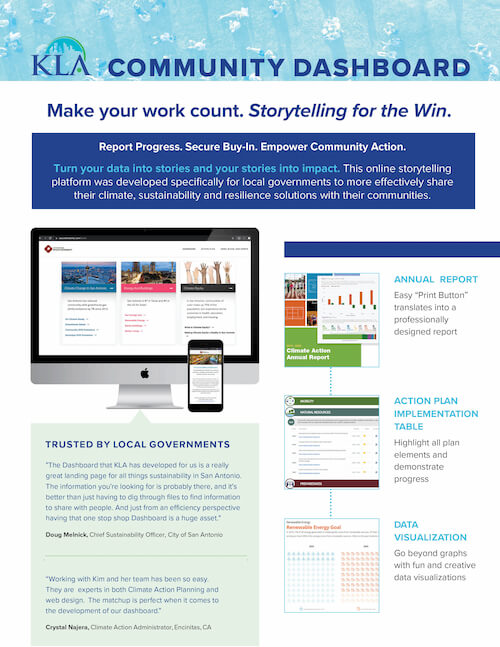
Developed specifically for local government sustainability professionals, the KLA Community Dashboard is a platform that turns data into stories and stories into impact. 

Show your community how you're pursuing climate, sustainability and resilience solutions. 


Tell them about the progress to date and what's on deck. 


Share with them ways to take action to meet your goals.

Key Features

Storytelling Platform

Storytelling Platform
The Dashboard is designed to showcase data points as stories to most effectively engage community members and lead them to action.

Blog and News Feed

Blog and News Feed
Keep community members informed about your progress, connect the dots on community goals and their actions, and tie it to current events.

Compelling Graphics

Compelling Graphics
Dazzle, inform and engage by going beyond plain text.

Versatility and Impact

Zabrina Rapozo, San Antonio's Climate Program Manager, talks about their use of KLA's Dashboard for the SA Climate Ready Plan and how the KLA team supports their strategy development and implementation.
 

Enhanced Features

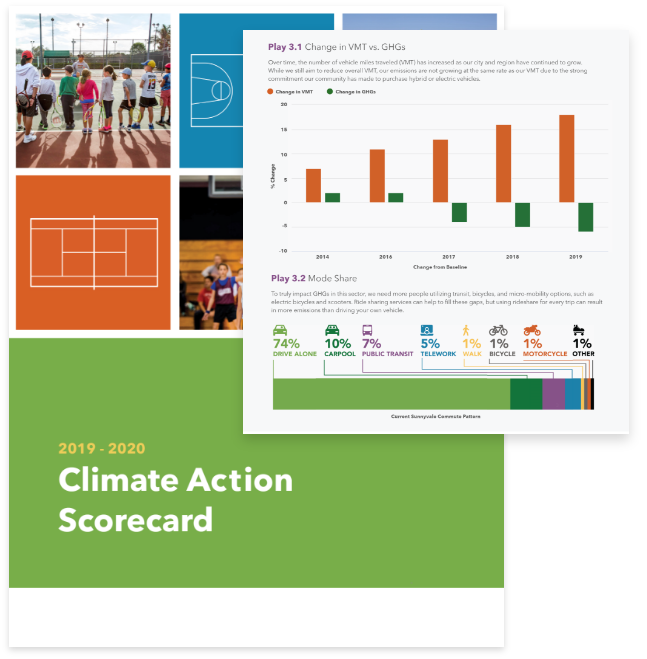
Annual Report

Annual Report

Like a “print button” to easily produce reports on key content, graphs, images, and data visualizations that are already on your dashboard site.
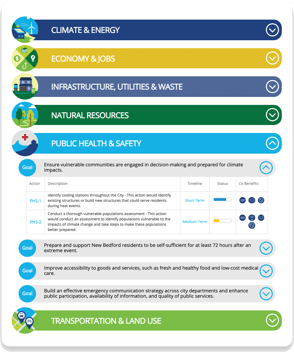
actionplan-example

Action Plan Implementation Table

Showcase plan elements, goals, actions, and timeline to demonstrate progress. Mobile-friendly accordion style. 
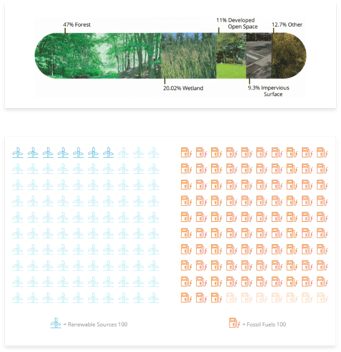
Data Visualization

Data Visualization

Go beyond graphs with fun and creative data visualizations like the multi-image graph or a pictograph.
APA map

Additional Features

Calculators
Multi-question calculators to help community members determine costs for things like solar panels and electric vehicles.

Infographics
Turn more complicated, nuanced or multi-layered information into user-friendly visuals. 

Quick Polls
Get direct feedback and engagement from people with quick, interactive poll questions.

Resource Center
Make it easy for people to find local resources and take action. 

Story Maps
Share sustainability achievements or local resources (like EV charging stations) with maps and images. 

GHG Reductions Pathways/Wedge Analysis
Interactive chart allows users to click on and off different projects or sectors to see how emissions are affected if those are not implemented.

NPC

APA 2025

APA-2025
APA-2025
APA-2025
APA-2025
APA-2025
APA-2025
APA-2025
APA-2025
APA-2025

What we shared at the APA Conference 

Dashboard Overview
Dashboard-overview
KLA Services
Services-overview
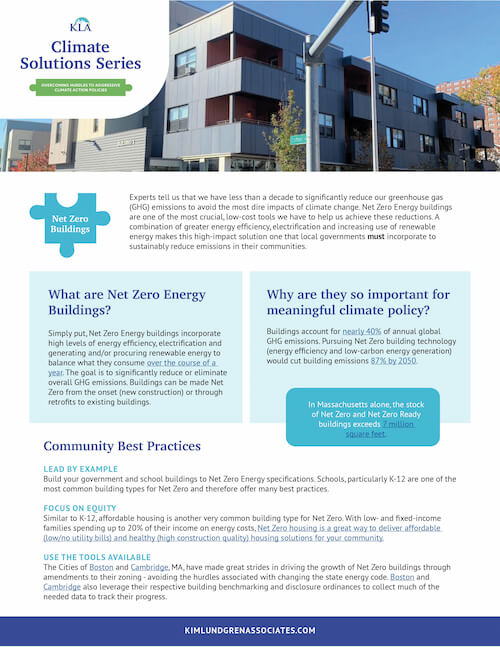
Net Zero Tipsheet
NetZero
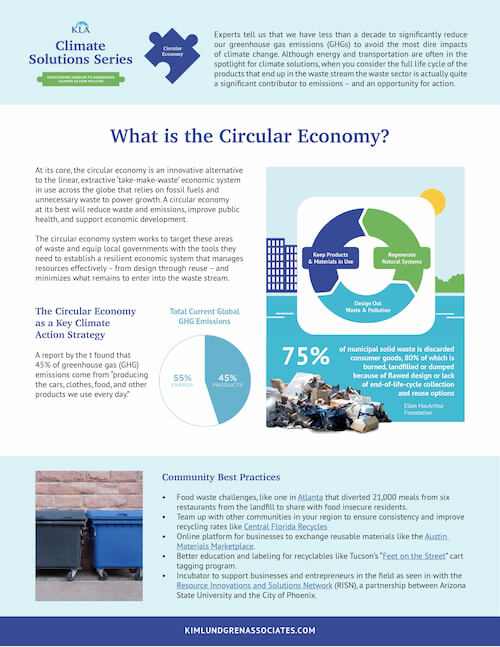
Circular Economy Tipsheet
CircularEconomy

Engaging. Customizable. Affordable.

Starting at less than $10,000 a year

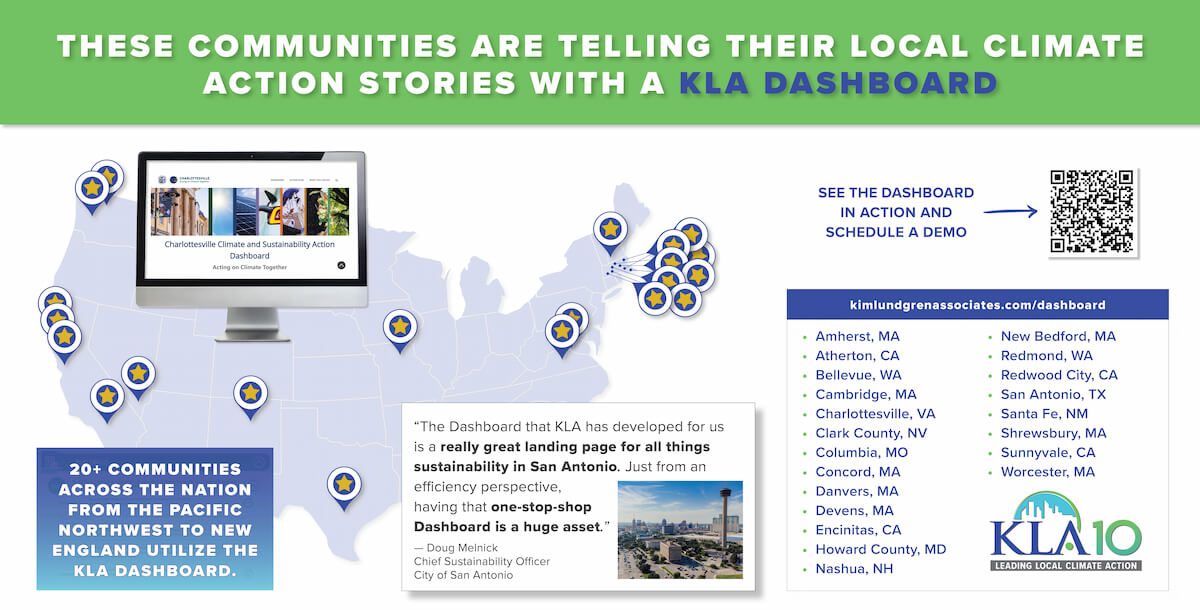
Communities like San Antonio, TX, Nashua, NH, and Encinitas, CA, use the KLA Community Dashboard platform for their climate and sustainability work.

Our clients enjoy:

  • Visuals that bring data to life
  • Unique storytelling structure for true engagement
  • Communications and social media support
  • Self- or full-service options

Trusted by local governments:

The City of San Antonio’s Sustainability Dashboard website is an essential tool for community engagement. As a visual representation of our climate plan, residents and others can quickly access information that is organized intuitively and presented attractively. Recently, the KLA team has embraced our city’s commitment to digital inclusion and has worked with our team to further our accessible resources.
Julia Murphy
Deputy Chief Sustainability Offer, San Antonio, TX
The Livable Nashua dashboard created a totally new way for the City to educate the public on the many great programs and initiatives we are already doing, provide transparent data and really start engaging the community on long-term goal setting. Working with KLA has been a truly positive relationship. They are organized, clear, concise and completely able to implement projects on schedule.
Sarah Marchant
Community Development Director, City of Nashua, NH
Working with Kim and her team has been so easy. They are experts in both Climate Action Planning and web design. The matchup is perfect when it comes to the development of our dashboard. I don’t have to explain our data or emissions reduction goals – KLA just knows! We’re really excited to see what the KLA team comes up with for our dashboard!
Crystal Najera
Climate Action Administrator, City of Encinitas, CA
I love love love the social media content KLA sends every month, it is exactly what we need to engage the community in a fun and interactive way. We would never have time to generate this content ourselves.

KLA didn't just check the boxes. They helped us make the most of the MA Municipal Vulnerability Preparedness program by including equitable community engagement and a series of compelling educational videos - which were a big hit in town! It has built a solid foundation for resilience in Concord thanks to KLA.
Kate Hanley
Sustainability Officer, Concord, MA
back to top