My Journey -- and Jeep's -- to Keep the Same Driving Vibe with Very Different Results
By Danielle Civitillo, KLA's Director of Technology
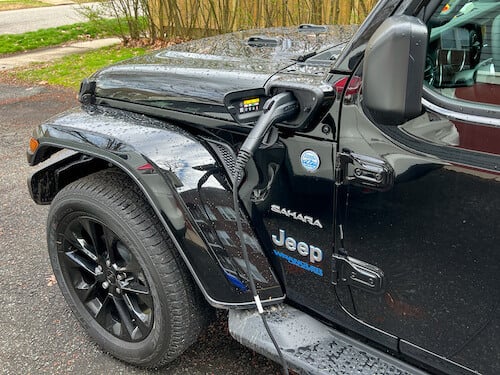
When you make lifestyle choices and purchases that are considered “green,” it’s often painted as a “sacrifice.” My experience moving from a standard to a plug-in hybrid electric Jeep Wrangler tells a different story.
The process required patience -- it’s a decision that even seasoned journalists who write about things like EVs for a living apparently struggle with -- but the end result is that I’m still driving my coveted Jeep, and now I’m also saving money at the pump and doing my part (not just Earth Day but every day!) to save the planet.